Home » Matplotlib Quiver plot in python

Matplotlib Quiver plot in python

Oracle Java Certification
1 Year Subscription
Java SE 11 Programmer II [1Z0-816] Practice Tests
Java SE 11 Programmer I [1Z0-815] Practice Tests
Spring Framework Basics Video Course
Java SE 11 Developer (Upgrade) [1Z0-817]

A matplotlib Quiver plot is a type of 2D plot which shows vector lines as arrows. Quiver(X,Y,U,V) plots arrows with directional components U and V at the Cartesian coordinates specified by X and Y.

The first arrow originates from the point X(1) and Y(1), extends horizontally according to U(1), and extends vertically according to V(1).

Syntax

matplotlib.pyplot.quiver([X, Y], U, V, [C])

Parameters

Where XY define the arrow locations, UV define the arrow directions, and C optionally sets the color.

Arrow size

The default settings auto-scales the length of the arrows to a reasonable size. To change this behavior see the scale and scale_units parameters.

Arrow shape

The defaults give a slightly swept-back arrow; to make the head a triangle, make headaxislength the same as headlength. To make the arrow more pointed, reduce headwidth or increase headlength and headaxislength. To make the head smaller relative to the shaft, scale down all the head parameters.

Arrow outline

linewidths and edgecolors can be used to customize the arrow outlines.

Parameters:
X, Y : 1D or 2D array-like, optional

The x and y coordinates of the arrow locations.

If not given, they will be generated as a uniform integer meshgrid based on the dimensions of U and V.

If X and Y are 1D but UV are 2D, XY are expanded to 2D using X, Y = np.meshgrid(X, Y). In this case len(X) and len(Y) must match the column and row dimensions of U and V.

U, V : 1D or 2D array-like

The x and y direction components of the arrow vectors.

C : 1D or 2D array-like, optional

Numeric data that defines the arrow colors by colormapping via norm and cmap.

units : {‘width', ‘height', ‘dots', ‘inches', ‘x', ‘y' ‘xy'}, default: ‘width'

The arrow dimensions (except for length) are measured in multiples of this unit.

The following values are supported:

  • ‘width', ‘height': The width or height of the axis.
  • ‘dots', ‘inches': Pixels or inches based on the figure dpi.
  • ‘x', ‘y', ‘xy': XY or X2+Y2−−−−−−−√X2+Y2 in data units.
angles : {‘uv', ‘xy'} or array-like, optional, default: ‘uv'

Method for determining the angle of the arrows.

  • ‘uv': The arrow axis aspect ratio is 1 so that if U == V the orientation of the arrow on the plot is 45 degrees counter-clockwise from the horizontal axis (positive to the right).

    Use this if the arrows symbolize a quantity that is not based on XY data coordinates.

  • ‘xy': Arrows point from (x,y) to (x+u, y+v). Use this for plotting a gradient field, for example.

  • Alternatively, arbitrary angles may be specified explicitly as an array of values in degrees, counter-clockwise from the horizontal axis.

    In this case UV is only used to determine the length of the arrows.

scale : float, optional

Number of data units per arrow length unit, e.g., m/s per plot width; a smaller scale parameter makes the arrow longer. Default is None.

scale_units : {‘width', ‘height', ‘dots', ‘inches', ‘x', ‘y', ‘xy'}, optional

If the scale kwarg is None, the arrow length unit. Default is None.

width : float, optional

Shaft width in arrow units; default depends on choice of units, above, and number of vectors

headwidth : float, optional, default: 3

Head width as multiple of shaft width.

headlength : float, optional, default: 5

Head length as multiple of shaft width.

headaxislength : float, optional, default: 4.5

Head length at shaft intersection.

minshaft : float, optional, default: 1

Length below which arrow scales, in units of head length.

minlength : float, optional, default: 1

Minimum length as a multiple of shaft width; if an arrow length is less than this, plot a dot (hexagon) of this diameter instead.

pivot : {‘tail', ‘mid', ‘middle', ‘tip'}, optional, default: ‘tail'

The part of the arrow that is anchored to the XY grid. The arrow rotates about this point.

color : color or color sequence, optional

Explicit color(s) for the arrows. If C has been set, color has no effect.


Examples

Basic single arrow example


import numpy as np
import matplotlib.pyplot as plt
 
 
# Creating arrow
x_pos = 0
y_pos = 0
x_direct = 1
y_direct = 1
 
# Creating plot
fig, ax = plt.subplots(figsize = (11, 8))
ax.quiver(x_pos, y_pos, x_direct, y_direct)
ax.set_title('Quiver plot with one arrow')
 
# Show plot
plt.show()

Quiver Plot With 2 Arrows

import numpy as np
import matplotlib.pyplot as plt
 
# Creating arrow
x_pos = [0, 0]
y_pos = [0, 0]
x_direct = [1, 0]
y_direct = [1, -1]
 
# Creating plot
fig, ax = plt.subplots(figsize = (11, 8))
ax.quiver(x_pos, y_pos, x_direct, y_direct,
         scale = 4)
 
ax.axis([-1.5, 1.5, -1.5, 1.5])
 
# show plot
plt.show()

Other examples

import numpy as np
import matplotlib.pyplot as plt

X, Y = np.meshgrid(np.arange(0, 2 * np.pi, .2), np.arange(0, 2 * np.pi, .2))
U = np.cos(X)
V = np.sin(Y)

fig1, ax1 = plt.subplots()
ax1.set_title('Arrows scale with plot width, not view')
Q = ax1.quiver(X, Y, U, V, units='width')
qk = ax1.quiverkey(Q, 0.9, 0.9, 2, r'$2 \frac{m}{s}$', labelpos='E',coordinates='figure')

plt.show()
import numpy as np
import matplotlib.pyplot as plt

X, Y = np.meshgrid(np.arange(0, 2 * np.pi, .2), np.arange(0, 2 * np.pi, .2))
U = np.cos(X)
V = np.sin(Y)

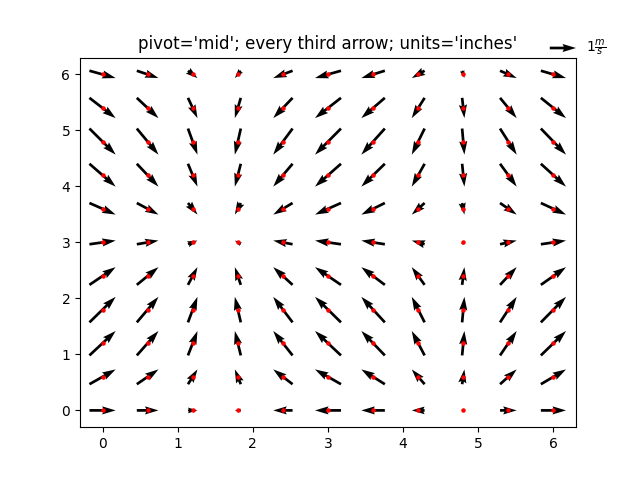
fig1, ax1 = plt.subplots()
ax1.set_title("pivot='mid'; every third arrow; units='inches'")
Q = ax1.quiver(X[::3, ::3], Y[::3, ::3], U[::3, ::3], V[::3, ::3],pivot='mid', units='inches')
qk = ax1.quiverkey(Q, 0.9, 0.9, 1, r'$1 \frac{m}{s}$', labelpos='E',coordinates='figure')
ax1.scatter(X[::3, ::3], Y[::3, ::3], color='r', s=5)

plt.show()

You may also like

Leave a Comment

This website uses cookies to improve your experience. We'll assume you're ok with this, but you can opt-out if you wish. Accept Read More